Author: Zhang Xiaoyuan Patent Analyst
One, the new wealth myth in 2021 is quietly breeding.
As of March 10, 2020, a total of 25 provinces, autonomous regions, and municipalities across the country have announced investment plans, with a total of 22,000 projects and a total investment of 496,000 billion yuan, of which the total investment planned for 2020 is 76,000 billion yuan. Based on the investment plans and market reactions that China has had in the past decade, there is reason to believe that in the future, the 50 trillion yuan of government investment in 2021 is bound to drive a new round of economic growth.
From the perspective of the massive investment of 50 trillion yuan, the focus is mainly on the construction of new infrastructure. It is expected that in the next 20 years, the new infrastructure such as 5G, ultra-high voltage, urban rail transit, charging pile, big data, artificial intelligence, Internet of Things and industrial Internet will develop into a powerful driving force for promoting the new round of technological development and economic growth in China with the support of massive government investment. Driven by such a powerful investment, the rapid development of the industry in the new infrastructure field is a highly likely event.
In particular, at present, the rapid development of China's new infrastructure field, in addition to the support of massive investment, is also加持 by many positive factors. First, the government firmly adheres to the policy bottom line of "not speculation for housing", actively guiding investment funds into the real industry; second, the Chinese stock market is becoming hot, and is about to reach the time cycle of the turn of the bull and bear markets, and the general view is that the hearts are rising, and the end of the epidemic may become a reasonable starting point for the bull market; third, although the Chinese economy has率先 experienced the impact of the COVID-19 epidemic, it has also率先 turned from negative to positive, and its performance is eye-catching and outstanding among the global economic powers; fourth, foreign capital is optimistic about China's economic development, and hot money continues to pour into the Chinese market, hoping to grow and profit with China's related industries.
The multi-dimensional superposition of these positive factors has further made the rapid development of the new infrastructure industry a matter of public expectation. Therefore, it is reasonable to expect that the birth of a new wealth myth in the new infrastructure field should only be a matter of time, and investment in technology centered on new infrastructure will become the core of this round of wealth myths.
Second, where is the trace of the 50 trillion wealth opportunity under the perspective of patents?
Based on the perspective of patent data, by comprehensively examining the relationship between patent data, technology and financial markets, we can get a glimpse of the types of enterprises that may be preferred by tech investors, and then find traces of new wealth opportunities.
1. The "patent ratio" indicator helps screen for tech companies with the potential to generate excess returns.
Research has found that for tech companies with a higher intensity of innovation, the correlation between their performance and stock price is not as high as we think; but it is worth noting that the fluctuation of their stock price is much larger than other industries. The main reason is that tech companies are highly dependent on technology! Whether it is the emergence of alternative technology, breakthroughs in technology itself, the introduction of special support policies for industries by the government, or unexpected events such as corporate mergers and acquisitions, technology mergers and acquisitions, intellectual property disputes, etc., they will bring large fluctuations in the stock price performance of tech companies. Therefore, based on tech intelligence, or through the research of patent intelligence to find tech companies with strong innovation, is closer to the investment needs of trend traders [1], which is conducive to telling trend traders which tech companies are more likely to help them achieve excess returns.
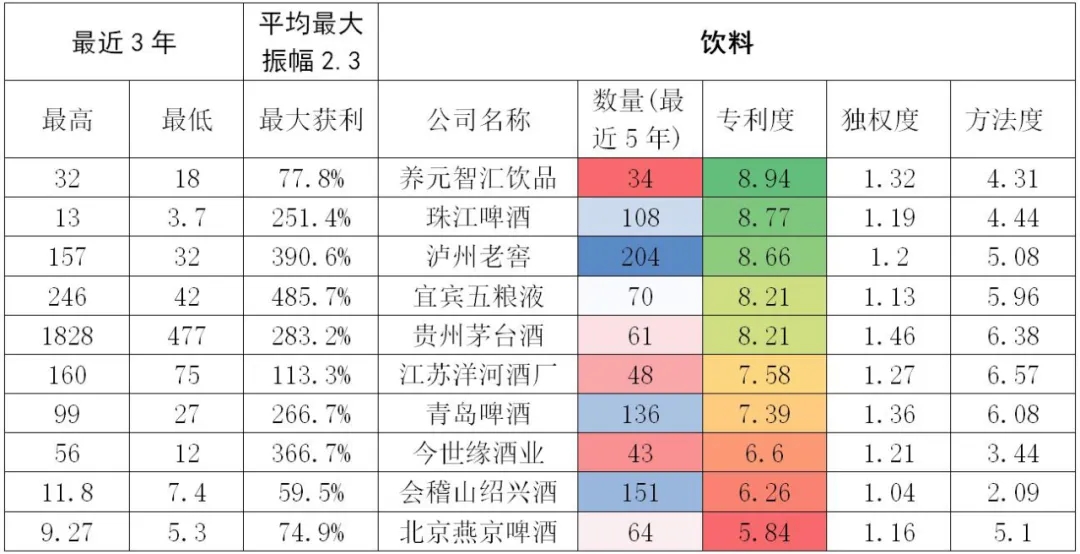
The semiconductor industry, pharmaceutical industry and beverage industry are three representative industries. These three industries have been highly focused on by traders and have been trading intensively in the past three years. The research shows that the average P/E ratio change of the semiconductor industry in the past three years is 2.2 times, the average P/E ratio change of the pharmaceutical industry in the past three years is 1.9 times, which is much higher than the 1.3 times of the traditional beverage industry. This also verifies the judgment we made before - the technology industry has greater volatility.
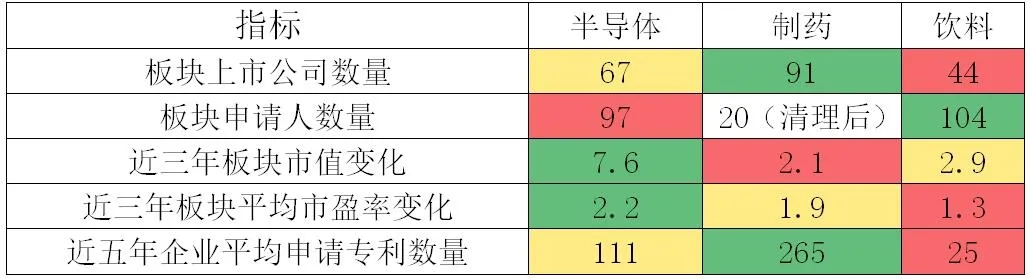
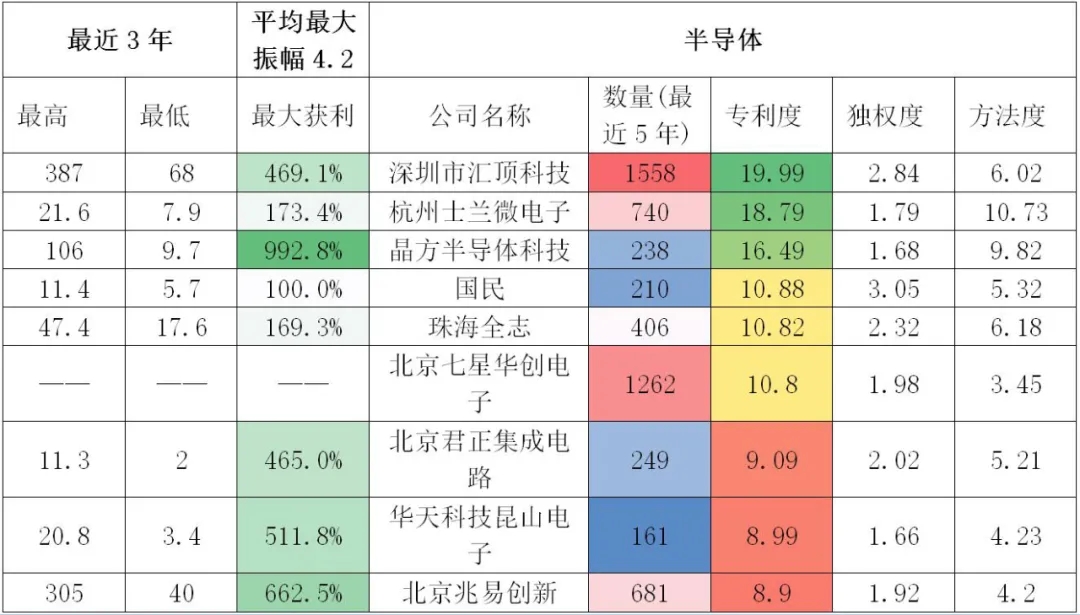
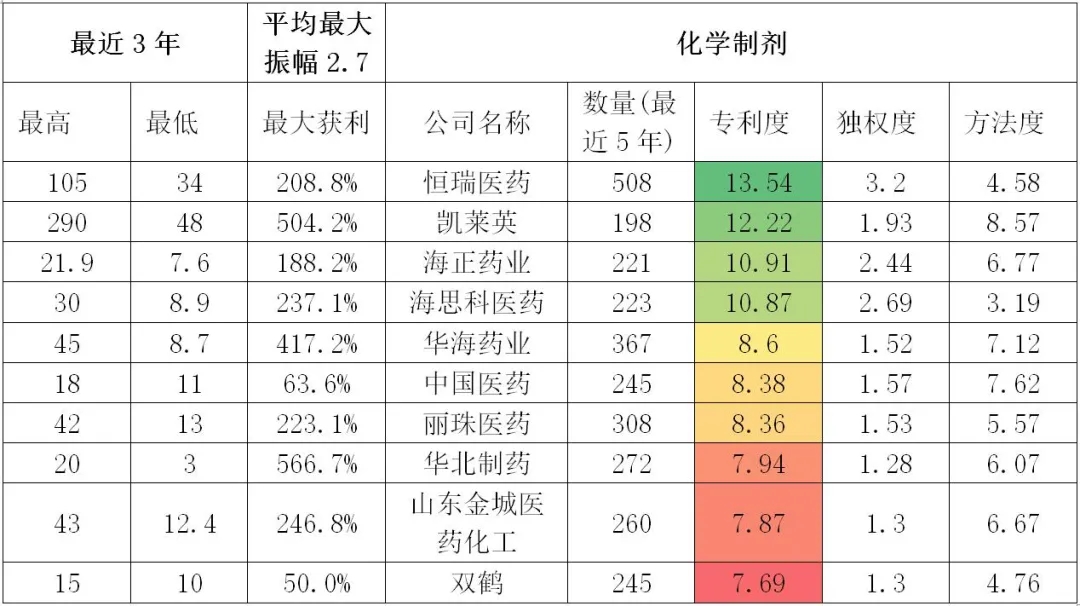
Further research finds that the "patent ratio" [2] data [3] can better find those companies that are more widely recognized by investors. For example, the data for the semiconductor industry sector is 67 companies. By searching for patents in the last 5 years (the application part of the last 3 years is not published), calculating the patent ratio and sorting, selecting the top 10 companies, it can be found that: the average stock price fluctuation of these 10 companies reaches 4.2 times, far exceeding the average P/E ratio change value of the industry 2.2. It can be seen that trend traders may obtain nearly a times excess return. The same is true in the pharmaceutical industry, where similar trends and situations are also found.
2. Data such as cited data, which are isolated, have high reference value for finding technology companies with strong technological competitiveness.
The so-called isolated data refers to a kind of data that can support researchers to make reasonable judgments when they cannot use other data. For example, PMI (Purchasing Manager's Index) is an isolated data. If someone wants to understand the operation of China's economy, if they don't want to look at other data, they can just look at the PMI data.
In the long-term evolution of technology, which companies can stand out in the fierce technological competition? Research finds that the "cited patent data" has certain research value: for example, for those companies that have clarified the core technology, they can judge whether the company's technology has basically taken shape from the prominent patent citation situation; whether the company is based on this technology to continuously expand the technical extension, and finally form a competitive advantage in the market. For example, the research finds that the companies with the top technology can have an average of at least 3 times of patent citation in a single month, and the more dense the data of patent citation, the stronger the company's technical research and development capability.
Hengrui Pharmaceuticals:
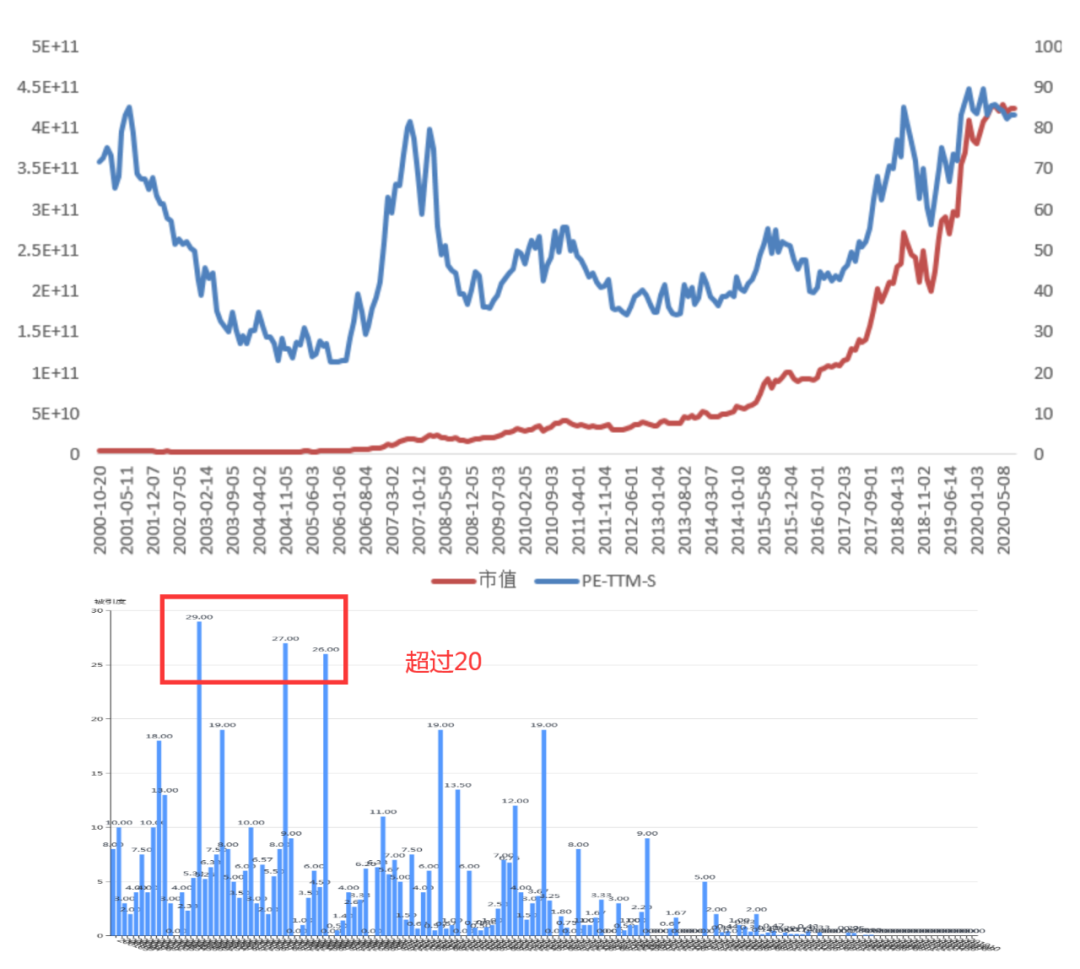
Hengrui Pharmaceuticals (the above chart shows the market value and PE trend, the below chart shows the patent citation data)
Hengrui Pharmaceuticals is a stable growth company for 20 years, and it is also an innovation-intensive company, and its patent citations appeared in three monthly peaks of 29, 27 and 26 before 2006.
Science and Technology Unifly:
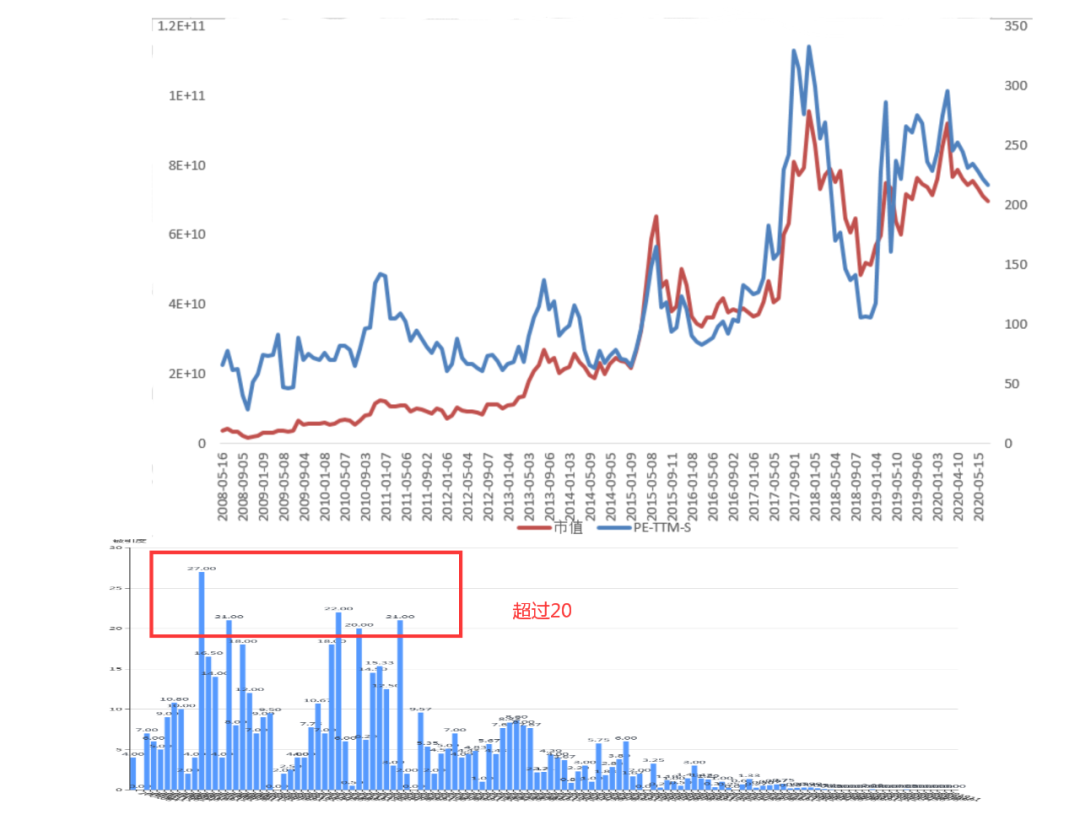
iFLYTEK (The above chart shows the market value and PE trend, and the below chart shows the patent citation data)
AI company iFLYTEK, which is also one of China's top tech companies. The company's market value has been steadily increasing, and it has maintained a very high P/E ratio for many years, showing strong market confidence. Such a company has experienced a monthly citation breakthrough of 20 three times before 2011.
Huawei:
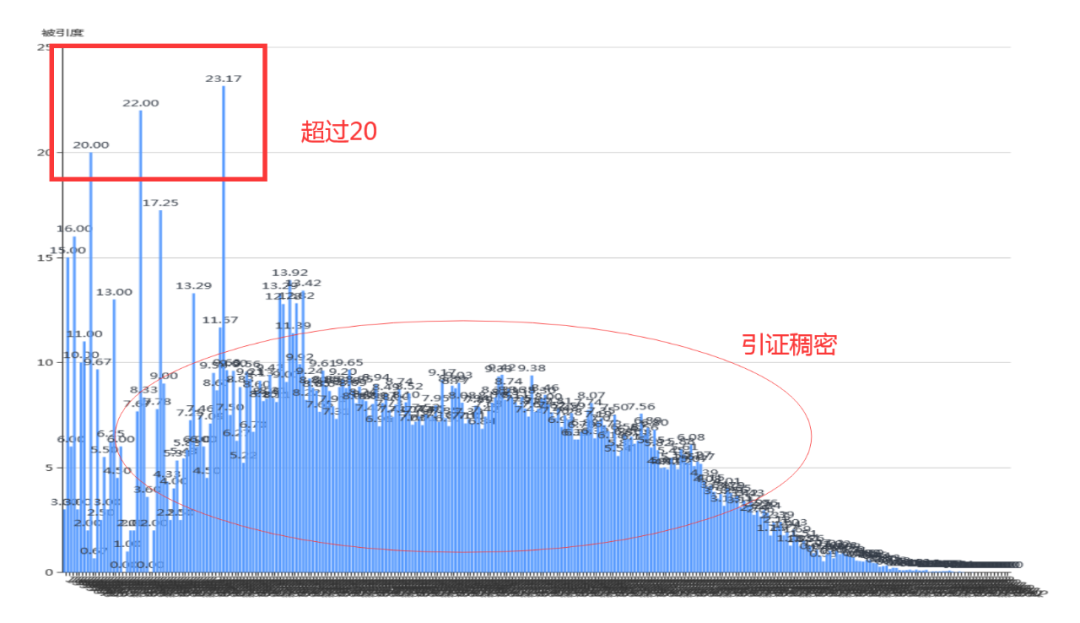
Huawei (patent citation is very dense)
Huawei's emphasis on technology and its "insane" R&D investment have always been a source of pride for the Chinese people. Since Huawei is not listed, it is impossible to know how the market will price Huawei. However, based on the density of patent citations, Huawei far exceeds other companies that the author has studied. Similarly, Huawei also experienced three citation incidents exceeding 20 in the early days, which is actually far below our expectations. However, based on the rate of technological iteration, the value of communication and internet single patents is generally declining, which also means that the number of monthly citations cannot be too high, which can also explain why it is below our expectations.
Three, Summary
1. The high-tech industry itself has the attribute of high volatility, and the companies selected based on patent rankings have greater volatility, i.e., trend traders can obtain excess returns in stocks with greater volatility, and semiconductor industry-type stocks can even achieve double the volatility returns. This kind of volatility is more suitable for trend traders rather than fundamental traders. In short, when the stock market turns from bear to bull, patent data may help investors find the most appropriate investment targets.
2. In addition, through the backtest of patent data, the author found that most successful tech companies have a phenomenon that the number of patent citations in 3 months exceeds 20, which may help us choose more appropriate companies.
The intention of this paper is to provide a new perspective for the readers who are currently engaged in related research, and any inappropriate aspects are subject to criticism and correction by the readers.
Notes:
[1] There are usually three types of traders in the financial market, namely, sentiment traders, trend traders, and fundamental traders. Sentiment traders are good at technical analysis, using market short-term fluctuations to trade for profit, and such traders are mostly retail, private equity, and quantitative trading based on artificial intelligence; Trend traders, using the flow of industry funds, profit from stock price fluctuations in the trend, with an investment cycle of usually medium-term, and such traders are usually retail and fund managers; Fundamental traders use valuation and industry judgment to make profits, which is more difficult, and is usually professional investment institutions, with a time horizon of medium to long-term.
[2] Patent depth is a quantitative indicator that selects the average number of claims of the applicant's patents within a certain period of time.
[3] The data used in this paper comes from patentics and touzid.